  One of the essential elements of H. T. Odum's symbolism
is: This symbol can be succintly defined as
storage (alternatively: stock). Storage represents the concentration of
a quantity (of matter, energy, structure or information). Such
concentrations can serve as energy sources able to drive
opportunistic pathways (i.e., they have the potential to make things
happen). Examples of resource stocks are:
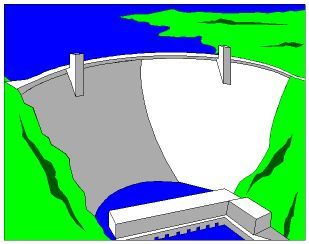
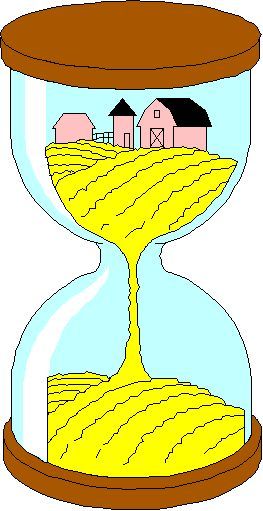
- Water reservoir
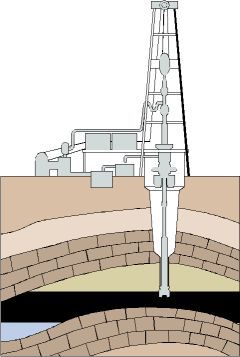
- Oil reservoir
|
Storage in a water
reservoir can be replenished, but oil exemplifies a stock of
non-renewable resource.
Consider (again) Paul
Harrision's characterization of resource drawdown (Chapter 17, The Third Revolution):
-
In the beginning is abundance. Resources are vast
in comparison with human numbers. Population density is low. There
is plenty for everyone: all people need to do is to collect what
is there. This is the gathering phase.
-
Gradually numbers multiply and exert increasing
pressure on resources. Yet at first people continue with the
technologies and attitudes of the gathering phase. The resource is
depleted. This is the mining phase. In some cases, when
fuelled by windfall profits, as in tropical forests, it reaches a
paroxysm in pillaging.
-
What follows is the crisis phase.
Potentially renewable living resources are not renewed, but
depleted below the level at which they can renew themselves.
Scarcities develop - hunted species disappear one by one, soil
yields fall, firewood and water have to be sought further and
further away. Depletion reaches the level at which it becomes
visible, even painful
|
Also consider the chart
represented below (in modified form) that Harrison utilizes to support his
narrative:
|
PRODUCTION SYSTEM & RESOURCE
STATE |
OWNERSHIP
|
PLANTFOOD
|
ANIMAL
|
FISH
|
WOOD
|
| Gathering - Abundant |
Communal
|
Gathering
|
Hunting |
Fishing |
Gathering |
| Fallow - Plentiful |
Communal |
Fallowing burn, hoe |
Pastoral, resting |
Fishing, closed seasons |
From fallow zone |
| Mining - Depleting |
Mixed |
Declining fallow |
Over-grazing |
Over-fishing |
Deforestation |
| [Crisis] |
Mixed |
Falling yields, hard soil,
weeds. |
Desertification |
Stock decline |
Wood shortage
|
The item of immediate relevance in
Harrison's chart is the designated sequence of (declining) "resource
state" specified in the left column (PRODUCTION SYSTEM & RESOURCE
STATE):
- Abundant
- Plentiful
- Depleting
- Crisis
|
Can we extrapolate from Harrison's
sequence to H. T. Odum's symbolism? Again, with
analogy to a traffic light (in this instance inverted - rotated
180°), consider the following:
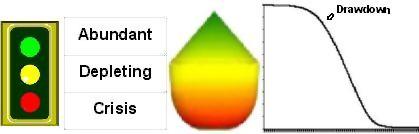
The color gradient
superimposed on the storage symbol in this graphic representation
(green, yellow, red) signifies a
change of resource stock level from abundant to
crisis as drawdown proceeds.
  In addition to
the storage symbol, another essential element of H. T. Odum's symbolism is: In addition to
the storage symbol, another essential element of H. T. Odum's symbolism is:
This symbol is defined as: energy (constant flow) source. The Earth's two
major energy sources are:
- constant infux of solar radiation
- endemic geophysical heat
flux.
|
Large-scale fluid dynamics within the atmosphere
and oceans are driven by solar influx. The slow, viscous movement of the
Earth's rocky continental plates is driven by the convective flow of the more
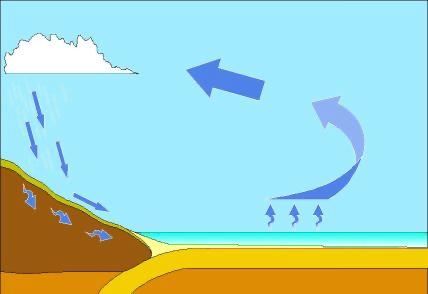
fluid molten layers beneath. Additionally, energy flow is integral to processes such
as the hydrologic cycle and the flow of
materials within ecosystems associated with the overall process
of maintaining life.
How is energy flow related to
energy stocks? Göran Wall graphically represented the
relationship as follows:
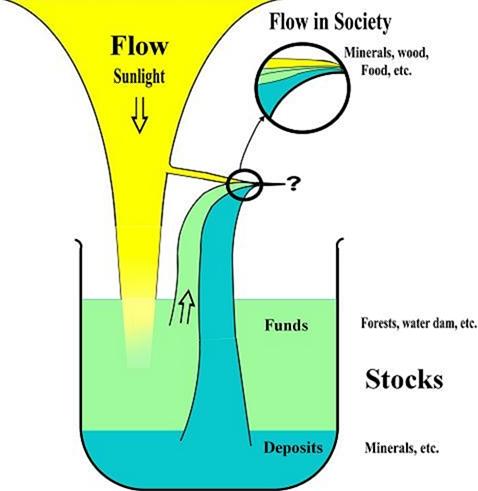
Wall's distinction between stock funds
and deposits belies the differing temporal magnitudes required for the
geophysical formation of funds (such as forests) and deposits (such as the
metal ores); Wall's division of stocks into
"funds" (forest, water dam, etc.) and "deposits" (minerals, etc.) parallels the designation by Tom Abel of three resource types:
|
Type |
Examples |
| Renewable |
Water, air, grass |
 |
| Slow-Renewable |
Soil, trees |
 |
| Non-Renewable |
Metal ores, fossil fuels |

|
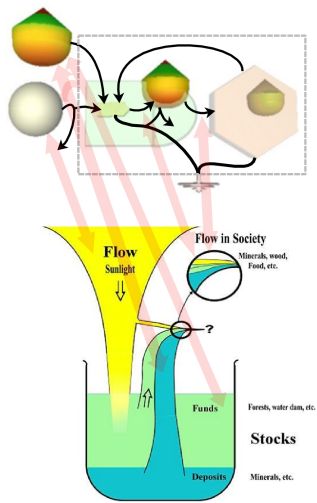
Associations of stocks and flows in
Odum’s simulation model with Wall’s schematic representation can be rendered
as follows:
|